Data Visualization
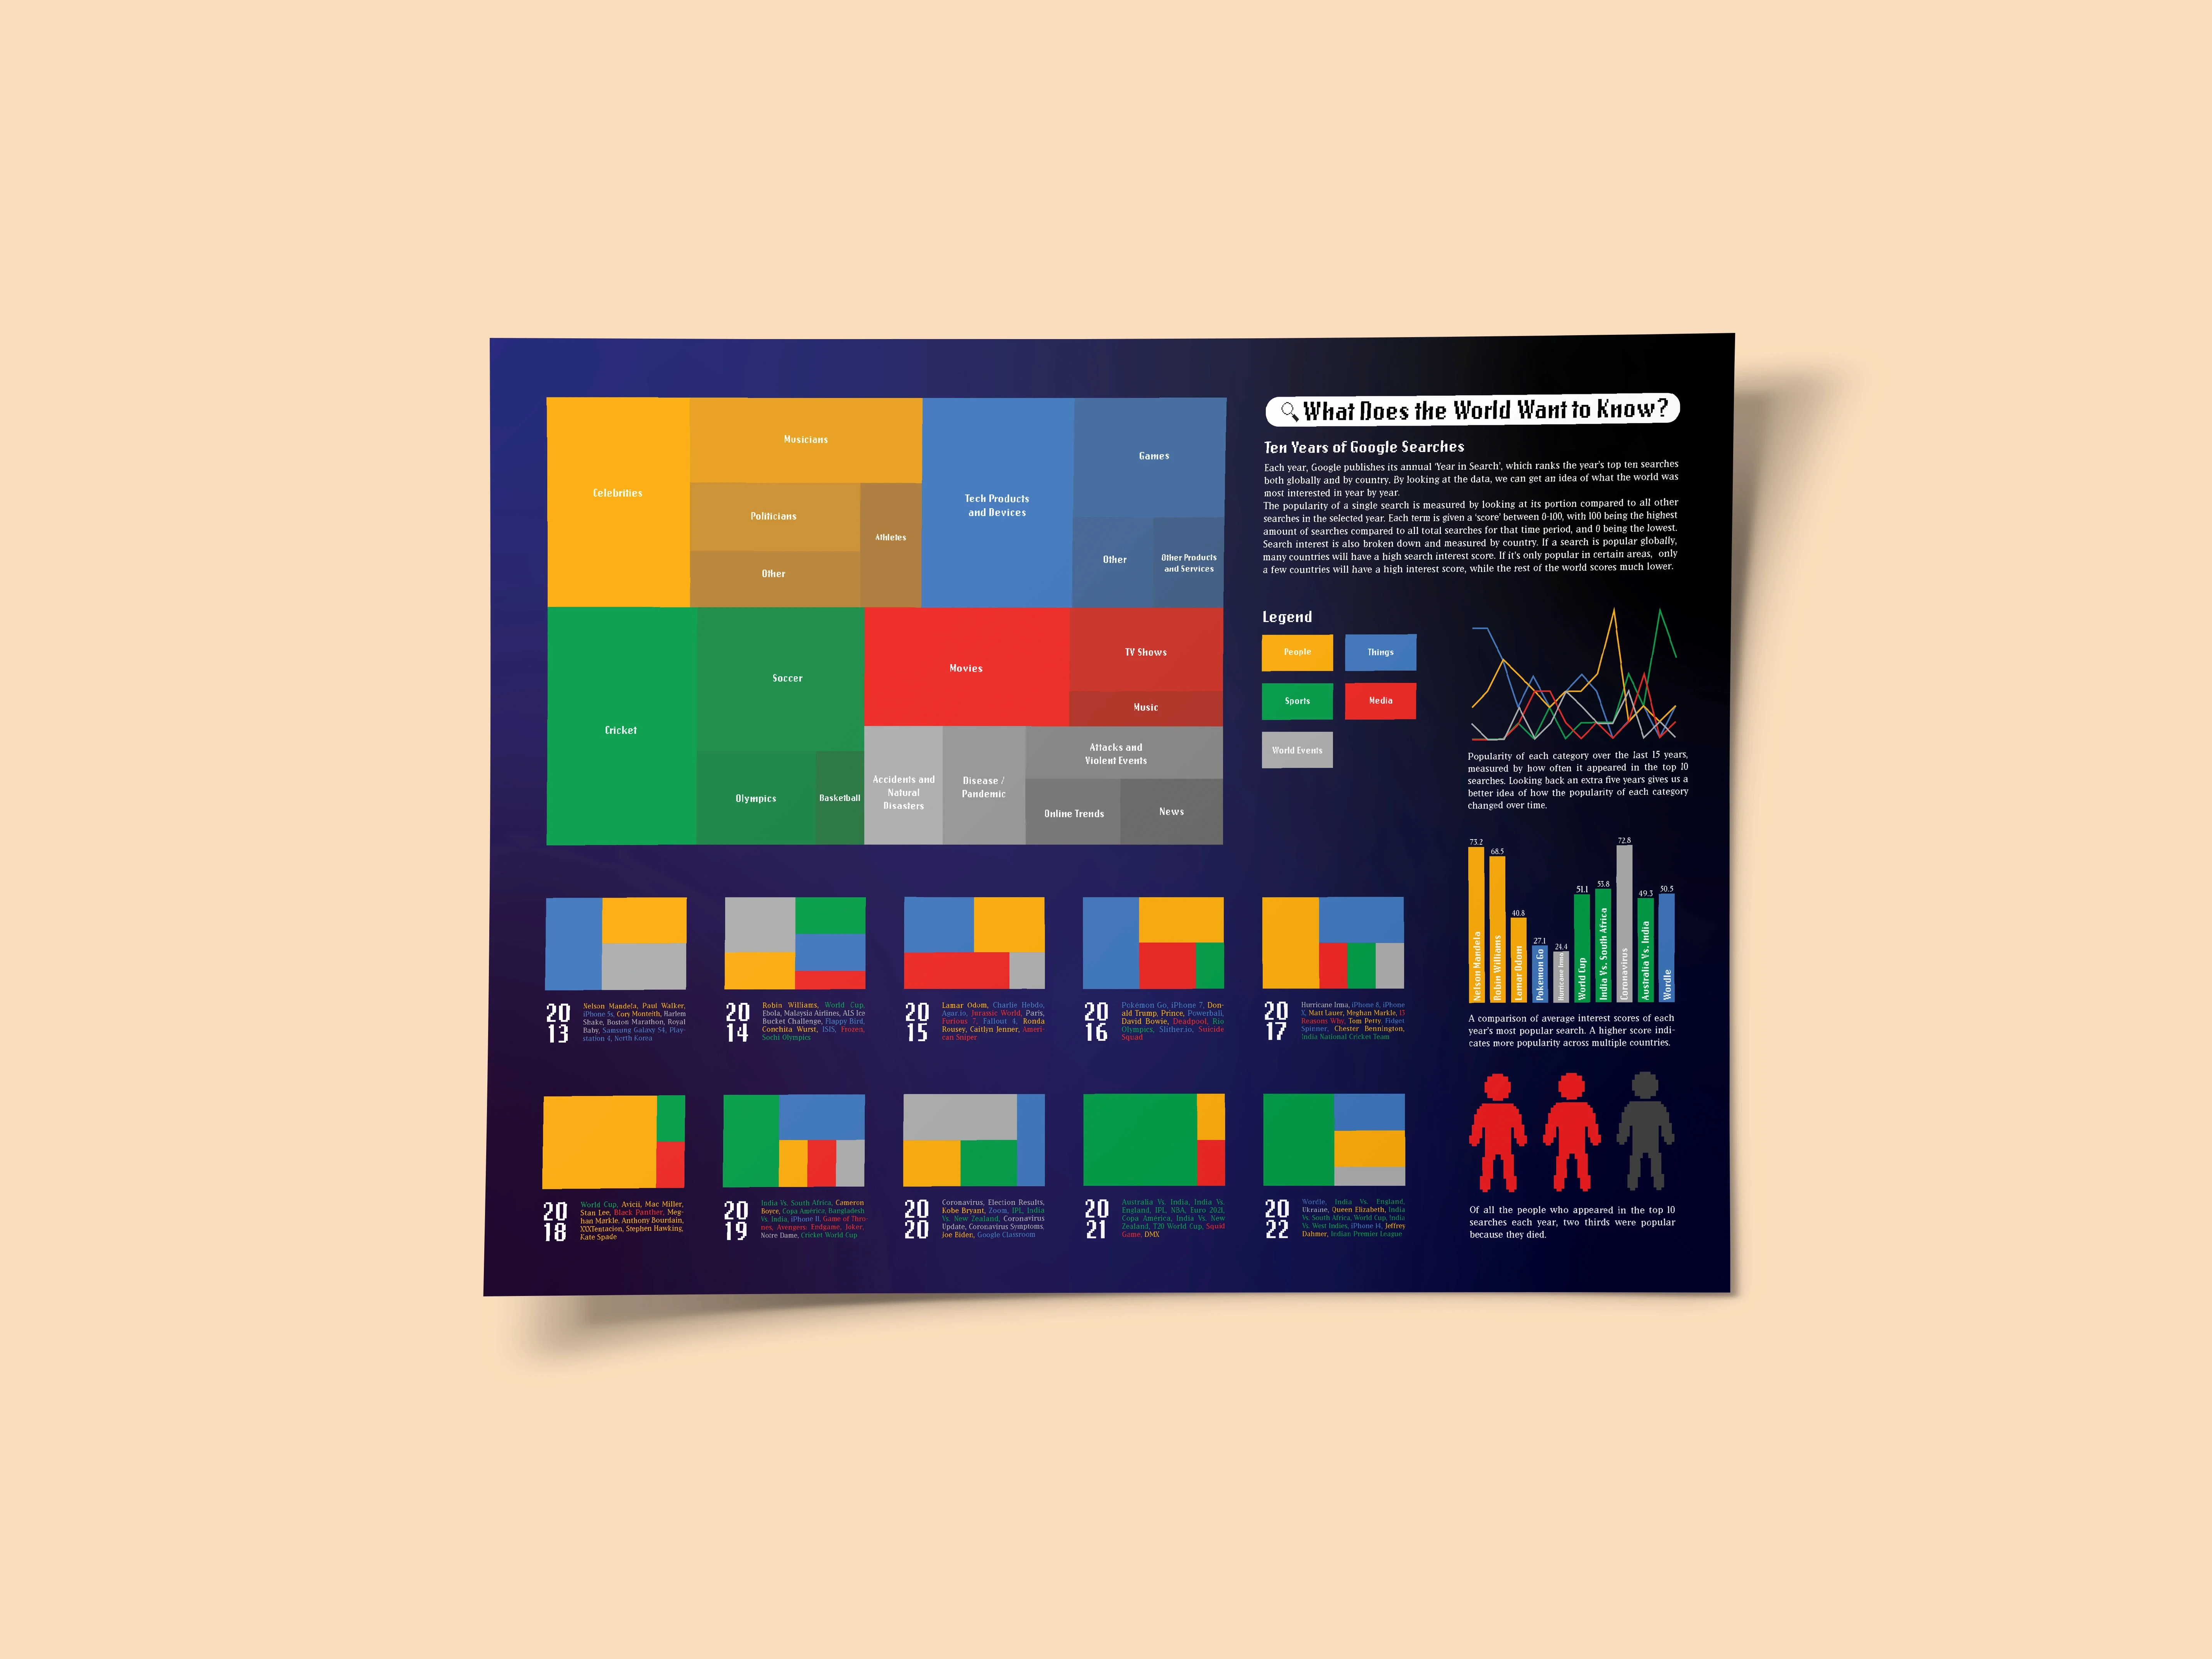
An infographic exploring ten years of Google search data. This piece takes a huge range of information and condenses it into something engaging and understandable for a wide audience, inviting them to travel back in time and recall what was going on in the world in previous years. The visuals pay tribute to the Google brand and the feel of early internet art and design. This piece was selected for the AUArts President’s Show.
An infographic exploring ten years of Google search data. This piece takes a huge range of information and condenses it into something engaging and understandable for a wide audience, inviting them to travel back in time and recall what was going on in the world in previous years. The visuals pay tribute to the Google brand and the feel of early internet art and design. This piece was selected for the AUArts President’s Show.
Date
February 2023


© Christina Young 2025
© Christina Young 2025